Using Dashboards
Your analytiQa dashboard works like any modern BI portal. This page covers the parts specific to analytiQa: navigating between Dashboards and Discover, time windows, filters, saved views, and sharing.
Accessing Your Dashboard
Log in at your instance URL (you'll receive a login link), then select a data source: Jira, qTest, or Tosca.
Dashboards vs. Discover
The left-hand menu has two views you'll use most:
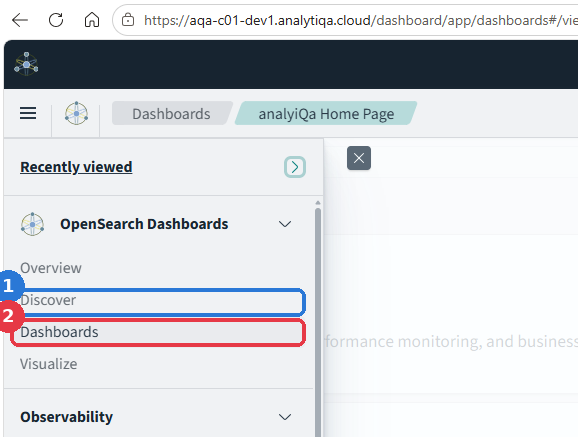
- Discover — Investigate raw, individual records (e.g. every field of a single Jira issue or test execution). Use this when you need to dig into specifics rather than trends.
- Dashboards — Curated, pre-built collections of visualizations for at-a-glance reporting. This is where you'll spend most of your time.
Layout at a Glance
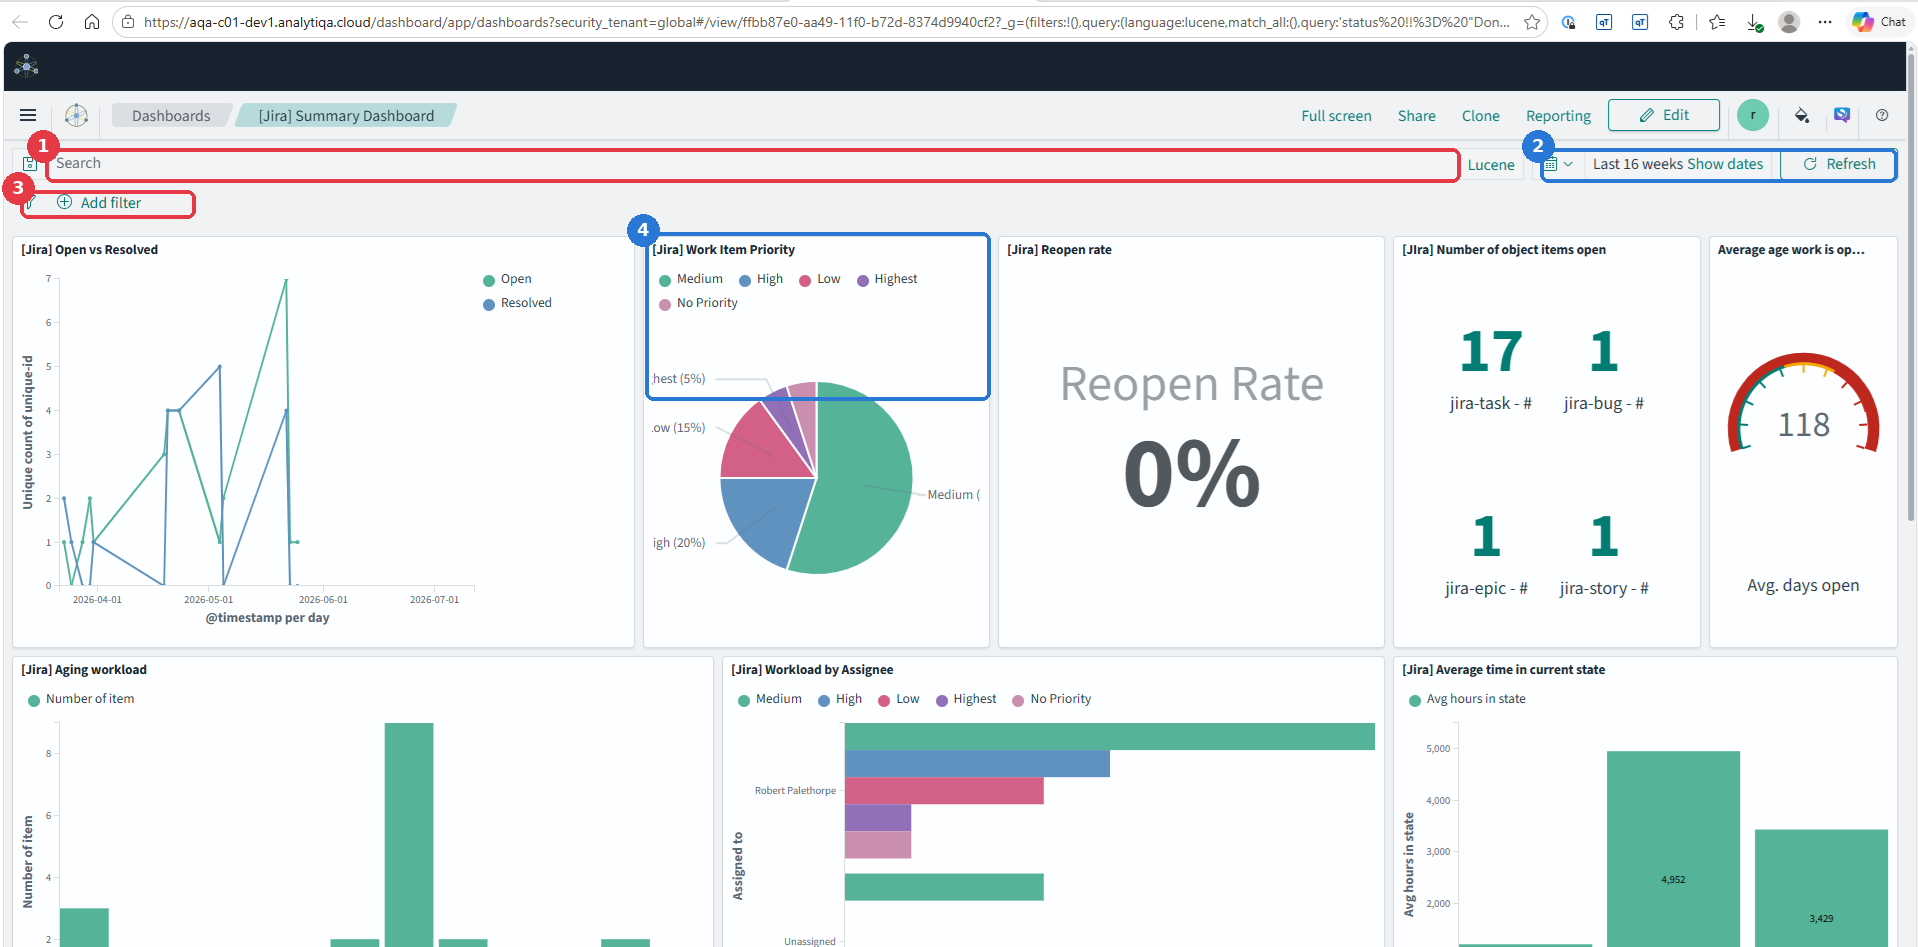
- Search — free-text or query-language search across the current data source.
- Time range — sets the window for every panel on the page at once.
- Add filter — narrow the data down by field (see Filters below).
- Visualization panels — each dashboard is a grid of charts and stat tiles like this one.
Time Windows
Use the time range picker (callout 2 above) to set the range for every panel on the page at once — presets like last 7/30/90 days, or a custom range. Saved views (below) remember their time window.
Filters
Click Add filter (callout 3 above) to narrow a dashboard down by field — for example, status: Open or priority: High. Once added, a filter appears as a pill below the search bar, where you can:
- Edit — change the field or value.
- Disable/remove — click the pill to toggle it off, or remove it entirely.
- Pin — keep a filter applied as you move between dashboards, so you don't have to reapply it each time.
Investigating Raw Data with Discover
When a dashboard raises a question you need to dig into, switch to Discover to see the underlying records.
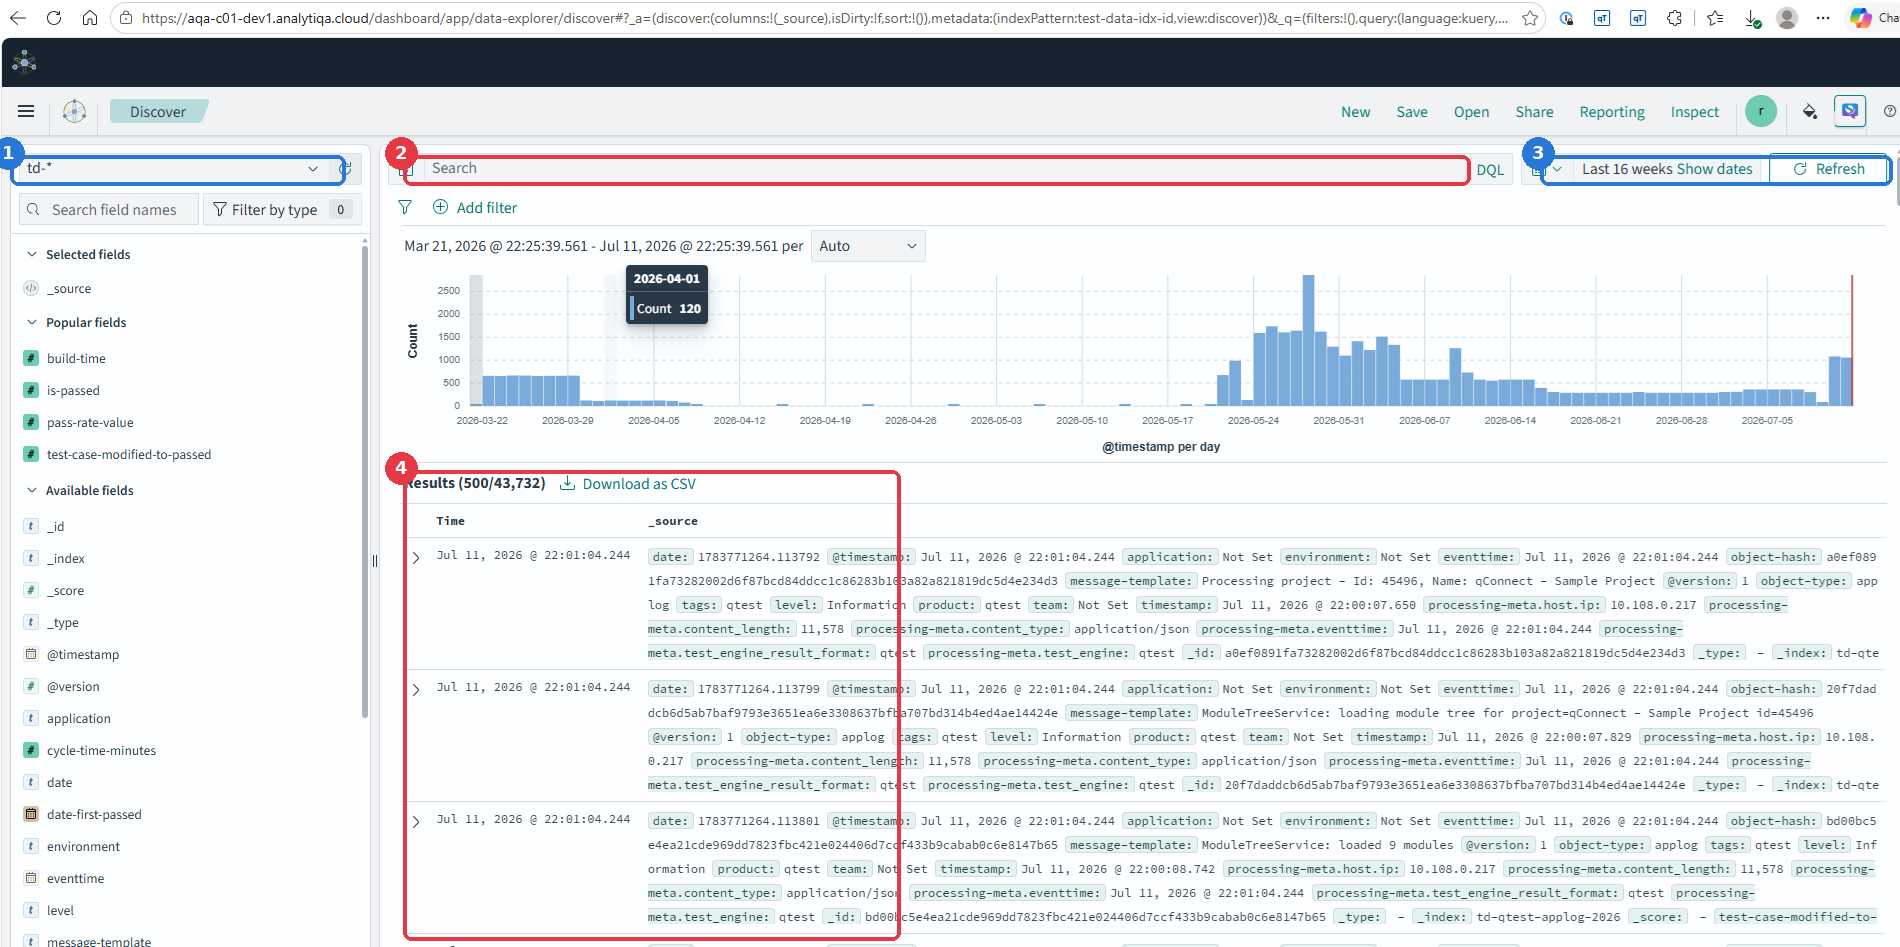
- Index pattern — which dataset you're browsing (e.g. Jira issues, qTest results).
- Search — same query bar as Dashboards, scoped to raw records here.
- Time range — same time picker behavior as Dashboards.
- Results table — every matching record, expandable to see all fields, with Download as CSV for offline analysis.
Saving Your Own Views
Save your current filters, time window, and layout as a named view (e.g. "My Standup"). Saved views appear in your sidebar for one-click access and are private to you unless shared.
Sharing
- Direct link — recipients need an analytiQa login.
- Export — CSV or JSON, for use outside analytiQa.
- Embed — for wikis or Slack, if enabled for your account.